
 Many people feel investing in the share market is a complex and scary concept. This is often due to a lack of understanding.
I have written a number of blogs about the advantages of index investing. However, I thought it might be useful to take a step back and take a look at the basics of share market investing.
How does the stock market work?
The share market is merely a place where people come to buy and sell shares. Some people will be buyers, and some will be sellers. They will each bid what price they are willing to buy or sell a particular stock. A deal will be done when they meet in the middle and agree on price. This is all done electronically (although, in Australia, prior to 1990, it was done on chalk boards).
You can see an example of this in the screen-print below (for CBA). As you can see, there are 9 people that would like to buy 455 shares in CBA shares for a price of $79.77. There are also 16 people that are prepared to sell 519 shares for $79.79. Seconds after taking this screen shot, the shares traded or $79.78 (i.e. the mid-point). These transactions happen all the time and this is how shares are valued by the market.

By the way, this is called market depth. That is, the number of buyers and sellers (and number of units) interested in trading a particular stock. It is important to invest in a stock with good depth to ensure your investment is liquid and fairly priced. More on this soon.
What is a company worth?
Obviously, the ‘market’ determines the value of a stock. As stated above, the market is made up of many buyers and sellers (most of them professionals).
There is a concept in financial theory called the Efficient Market Hypothesis (EFH) which states that the price of a stock reflects all available information about that stock and therefore is an accurate indication of its intrinsic value. Whilst this theory has some merit, I believe that EFM is truer in the long run than it is in the short run. In the short run, popularity can drive stock prices, not fundamentals.
Fundamentally, the value of a company is simply the present value of its future cash flows (i.e. profit). That is, what is the total value of say the next 10 years of profit after applying a discount rate (which is like an interest rate) to account for the businesses risk.
So, the key factor that investors must focus on is cash flow (profitability). There are only two reason why someone might invest in a business that makes low to no profit. Firstly, they invest in the stock on the expectation that the company’s business model is so compelling that it will generate strong profits in the future. Or, secondly, they are speculating that the stock price will continue to rise (this approach is more like gambling).
What are some of the key terms and when to use them?
I have listed below some of the key financial measures and terminology that are important to be familiar with if you want to invest in shares. Of course, there are lots of measures to look at, and they might vary between industries, so this isn’t an exhaustive list.
Earnings per share (EPS)
This is the amount of profit after tax that a company makes divided by the number of shares on issue. It is good if a company’s EPS is consistent (low volatility) and exhibits a good historic growth rate.
PE ratio
PE ratio stands for price-earnings ratio. This is calculated by dividing a stock’s price by its EPS. This tells you whether the stock is valued conservatively or aggressively. The long-term average PE in the Australian market is circa 15. Most of the top 200 stocks have a PE in the range of 10 and 25.
The higher the PE you pay, the longer it will take to generate an investment return (if at all), unless earnings increase significantly in the future.
For example, ANZ’s PE is 12.6 which means that in 12.6 years you would have made your money back (in terms of profit which is either paid as a dividend or reinvested). Compare that to accounting software provider, Xero. Its PE is expediential because it doesn’t even make a profit. The only way to make money from investing in Xero is to hold it for the next 20 years and hope they make a lot of money or hope that speculators continue to drive the share price up. Neither of these are great strategies. In the US, Netflix’s PE is 118. Why would you ever pay 118 times profit to by a share of a company? If your local pizza shop makes $100k p.a. in profit, I bet you wouldn’t buy the business for $11.8 million!
If you are a genuine, long-term investor, your starting valuation (PE) is a good predictor of long-term returns. If you pay a high price for a stock, it arguably leaves little future upside.
Dividend yield
This is the amount of the dividend you receive compared to the current share price. Dividend yields can sometimes be grossed up to include any imputation tax credits (see here for an explanation).
The higher the dividend yield, the less capital growth you need to justify an investment. That is, if you are aiming for a total investment return of say 8% and the stock pays a 5% dividend yield, then you only need 3% of capital growth to achieve your investment return.
Beta
A stock’s Beta is a measure of its volatility compared to the overall market. If a stock has a Beta of 1, it means that its price will move in line with the overall market. However, a Beta of say 1.5 means that if the market rises by 10%, the stock is expected to increase by 15%. A company’s beta tells you how “risky’ it is compared to the whole market. See more here.
Average volume
Average volume refers to the average number of shares traded per day. This tells you how liquid the stock is. Also, a stock with a higher turnover will likely have a more reliable share price because many different people, with different views and information, are trading the stock each day thereby setting the share price.
Historic earnings growth rate
There are two things that effect a stock’s value (because they impact the discount rate) being risk and growth. Risk refers to the stability of a company’s earnings i.e. do they vary much from year-to-year or are they very predictable. Growth refers to the historic growth in a company’s earnings.
Investors will typically pay a higher price (PE) for companies with lower risk and/or higher growth.
Dividend cover (or payout)
The dividend cover ratio (or sometime dividend payout ratio) refers to how much of the profit is paid out in dividends. A 100% payout ratio means they don’t retain any profit to reinvest in the business and that isn’t necessarily desirable.
How to achieve a diversified portfolio
How do you construct a portfolio of shares? The short answer is; you don’t. But I will get to this later. Here are a couple of things to consider:
Number of stocks
The common theme in all the analysis of share portfolio performance (good and bad) is simply diversification. This means not having more than 5% of your portfolio invested in any one stock. And studies have shown that you must invest in 20 to 25 stocks to achieve a meaningful amount of diversification. Lack of diversification is the biggest killer of investment returns.
Sector diversification
Companies are categorised into 11 different sectors (listed here). You should aim to achieve sector weightings similar to the most appropriate index (e.g. ASX200 below).
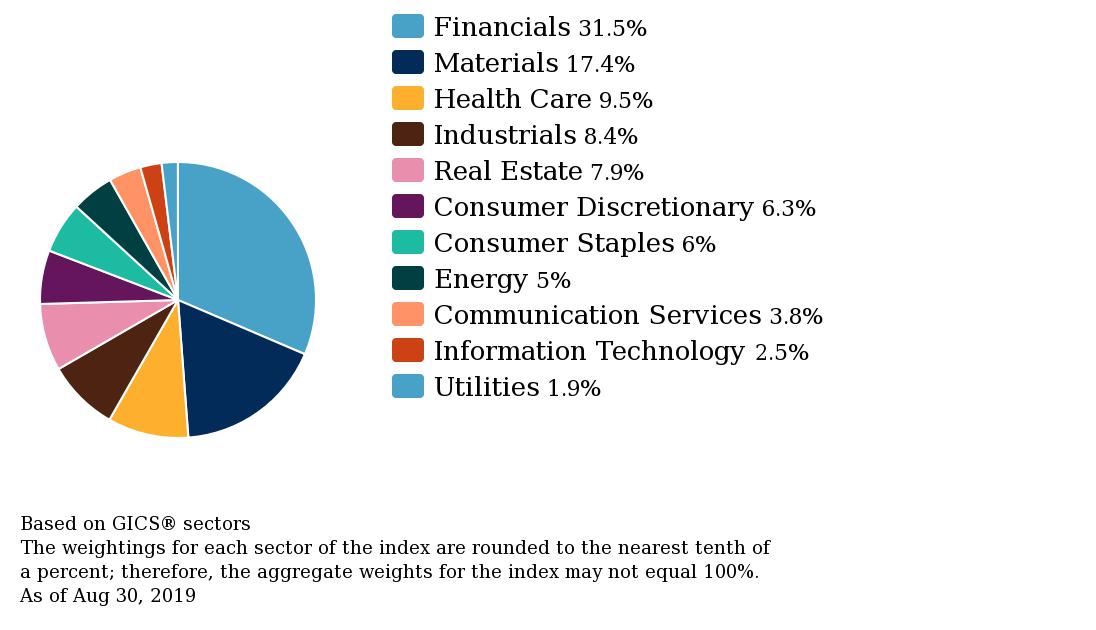
You may like to make tactical tilts in your allocation depending on your views e.g. if you are worried about an economic slowdown, invest more in consumer staples and health care, as these sectors tend to be less sensitive to economic conditions. However, you do not want too much exposure to any one sector.
Pick good quality stocks that have good growth prospects for a fair price
Focus on three things:
-
- Quality e.g. stable earnings, strong profitability, low debt, etc.
- Growth e.g. an industry or business model that has good future growth prospects.
- Fair price e.g. the lower the PE, the better.
What are the common mistakes share investors make?
I wrote this blog a couple of years ago which sets out the 4 most common mistake that share investors make. This information is still all relevant today.
The only thing I would add to it is that direct share investors never benchmark their investment returns (in my experience). That is, they do not work out how well they have done compared to market indices. This is insane. Why would you make all your own investment decisions and then not check to see whether you have done a good job or not? My guess is they probably don’t want to know because… ignorance is bliss. But ignorance won’t help you build wealth.
What is the best way to invest in shares?
Do not try and invest in direct shares. It’s too difficult to pick stocks that are likely to perform well in the long run, do it consistently year-after-year and know when to sell. The professionals can’t even do it. Last year, 93.23% of active fund managers in Australia failed to beat the index.
Therefore, the best solution is to construct a portfolio of low-cost index funds that utilise various rules-based mythologies and adopt tactical asset allocation tilts, to accommodate risks and opportunities (as explained here). If you have a substantial amount to invest, you should engage an independent financial advisor to help you do this effectively.
If you are starting out with small amounts, Vanguard offers diversified ETF’s which give you exposure to domestic and international shares, bonds, emerging markets and smaller companies all in one investment. You can access these via a low-cost, online share broker such as CommSec. It’s a perfect solution for smaller investment amounts.